Figma Design
Low fidelity mockup/wireframes
 |
 |
I created this mockup as a way to become familiar with Figma's tools. I quickly became comfortable with Figma due to similarity to other tools I have used previously.
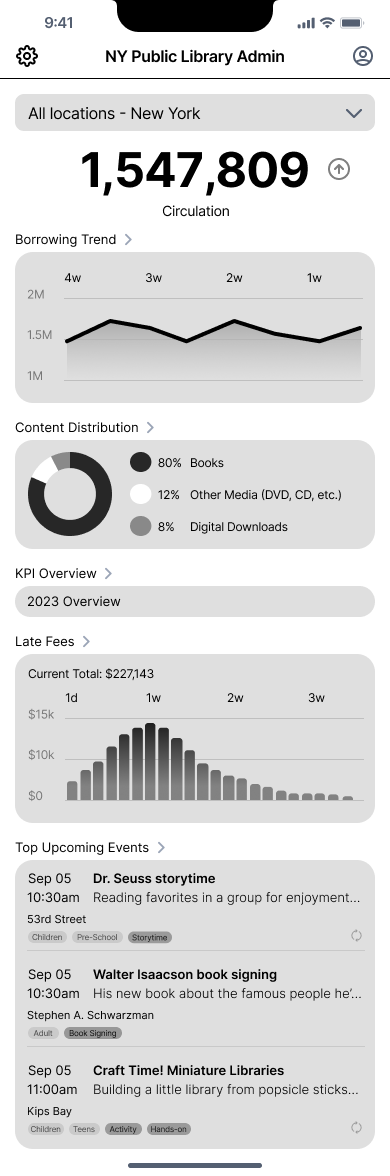
My concept for this project: the New York Public Library System needs an app where Administrators can monitor critical information. The screens below show wireframe mockups of a draft of the app, to concept how some data could be displayed. I did research to understand the basics of the NYPLS; data is from ~2016 timeframe.
This app could allow Administrators to:
- Select a group of libraries or an individual location
- See circulation and trends, content type, late fees, and events at the libraries
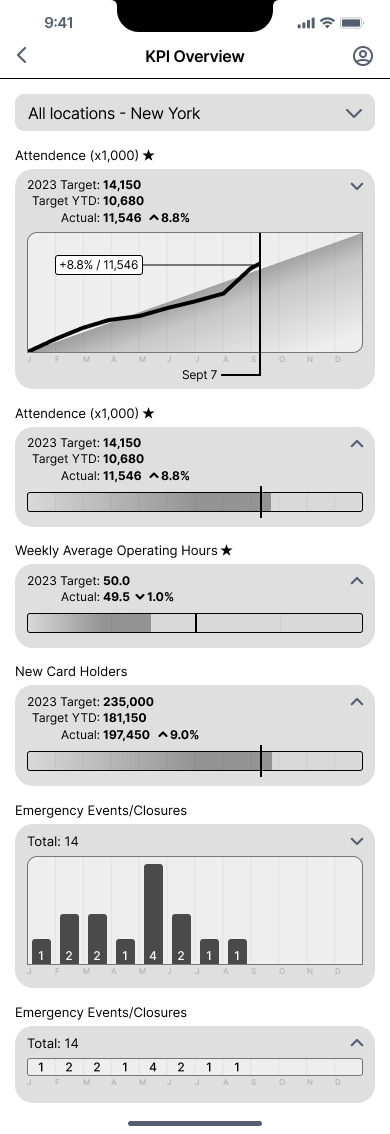
- View YTD status of Key Performance Indicators, which could have several types of data
- Accumulating totals with a current-point-in-time mark
- An average graph showing the current under/over
- A bar chart for monthly events
- Ability to toggle visualizations between a compact appearance and a larger, more detailed graph or chart
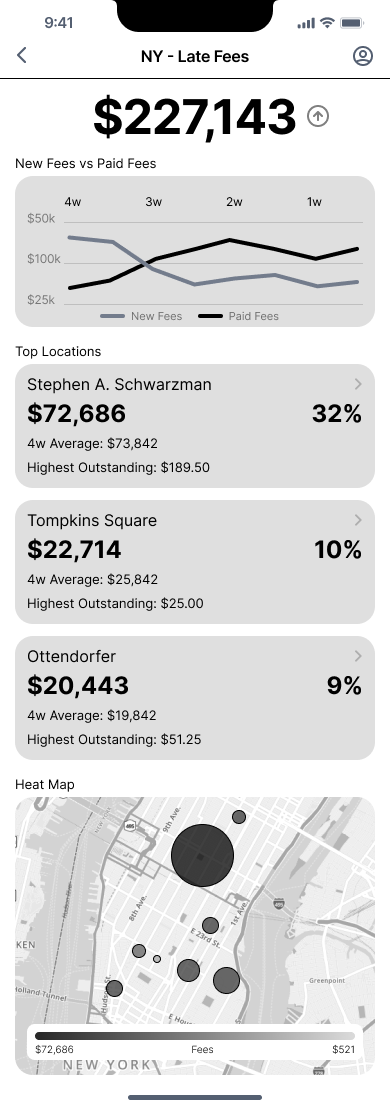
- See unpaid late fees are displayed in a bell shape curve
- Drill down on late fees to another screen displaying details such as new charges and paid fees, list of top locations and their outstanding fees, and a map with heat bubbles for their relative fees